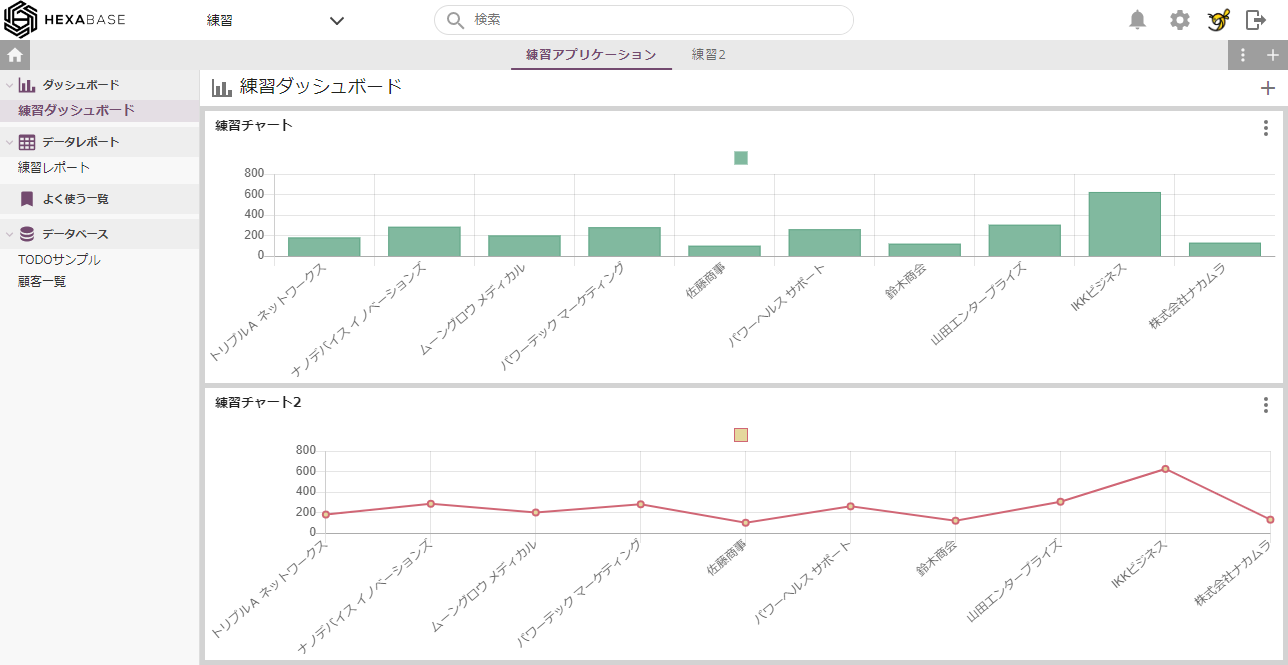
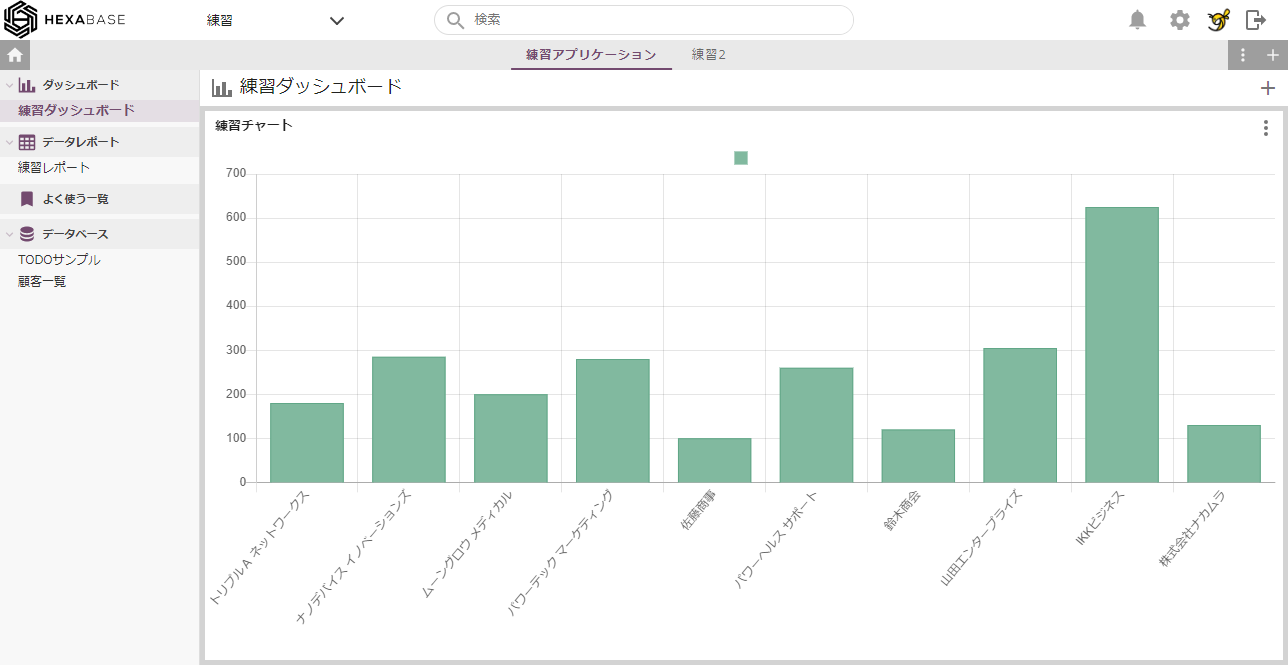
Dashboard
"Dashboard" is an area where multiple graphs (charts) are compiled. The graph displayed on the "Dashboard" is created based on the "Data Report".
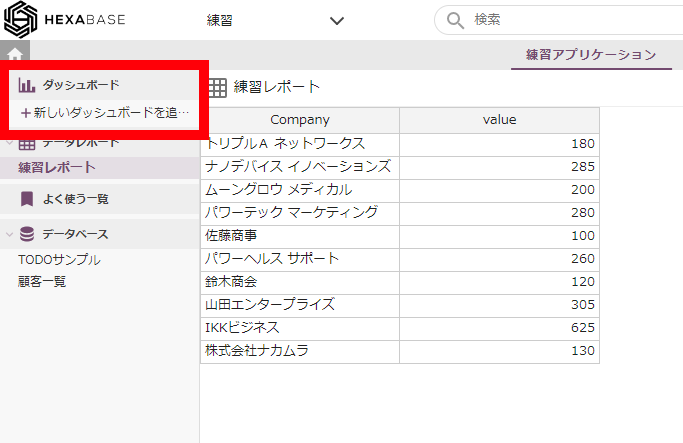
Create a dashboard
- In the left menu, click dashboard > +add new dashboard, or hover over dashboard and click the [ ⁝ ] button. Select +add new data report
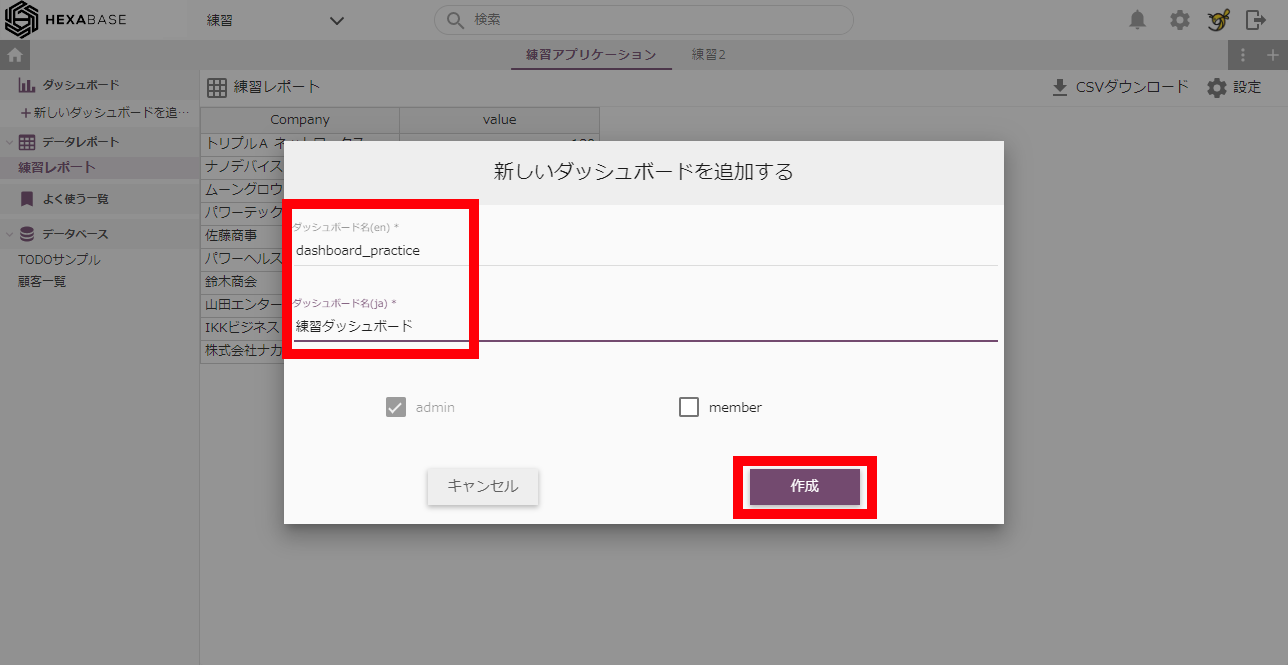
- Enter a dashboard name and click the create button
※ If you have already created a dashboard, create the second and subsequent dashboards using the [ ⁝ ] button.
Switch dashboard
If you have multiple dashboards, you can switch between them using the menu on the left.
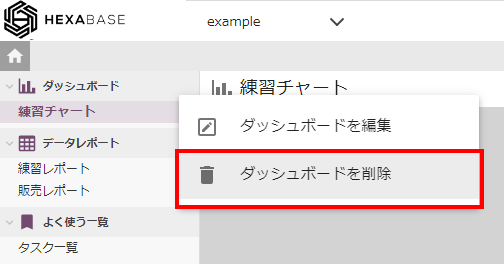
Delete dashboard
- In the left menu, hover over Data Report and click the [ ⁝ ] button
- Select delete dashboard
- Click the delete button when the confirmation pop-up appears
Create a new chart
When creating a chart, the data report must have at least three fields.
- Click on the "add new chart" button
- Enter a chart name and select the data report to be graphed
- Select "create new chart" as follows:
- Data Report: Practice Report
- Type: Bar chart
- X-axis: Select a field of text type "company"
- Y-axis: select a field of the numeric type "value"
- Series: Select text type field "group"
- Color scheme: Basic color
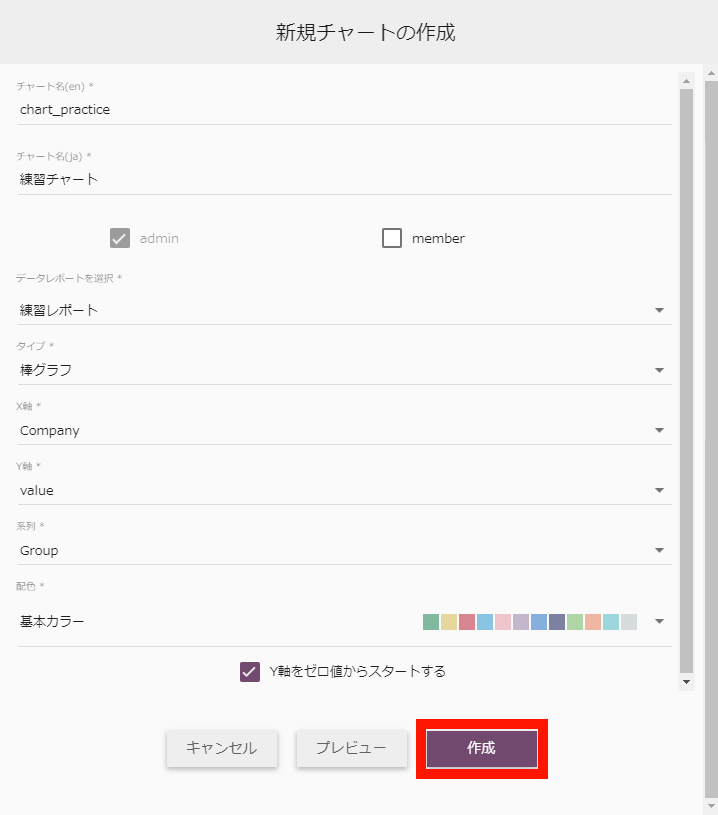
- After setting all the items, click the "create" button.
*Only "numeric" type fields can be selected for the "Y axis. "Numeric" type fields cannot be selected for the "X-axis" and "series" items. The field type is set when creating the database.
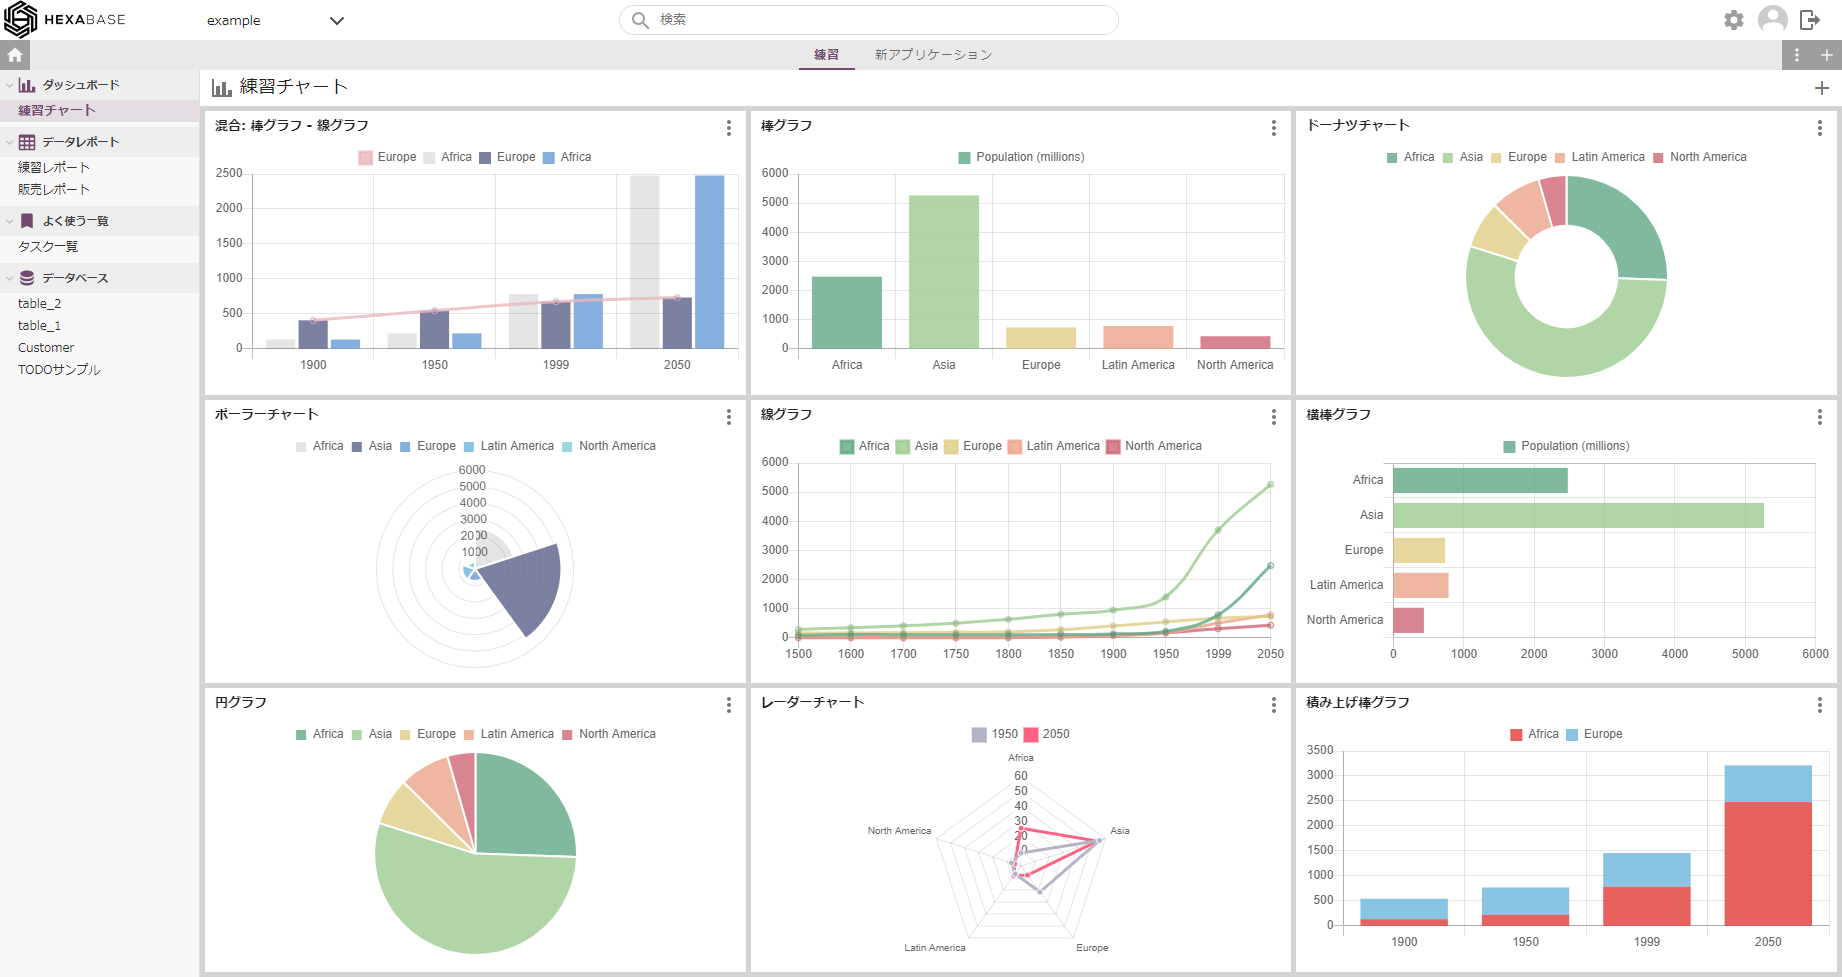
See chart example
If you have not created any charts, you can see examples of how to create charts by clicking the see examples button.
Edit chart
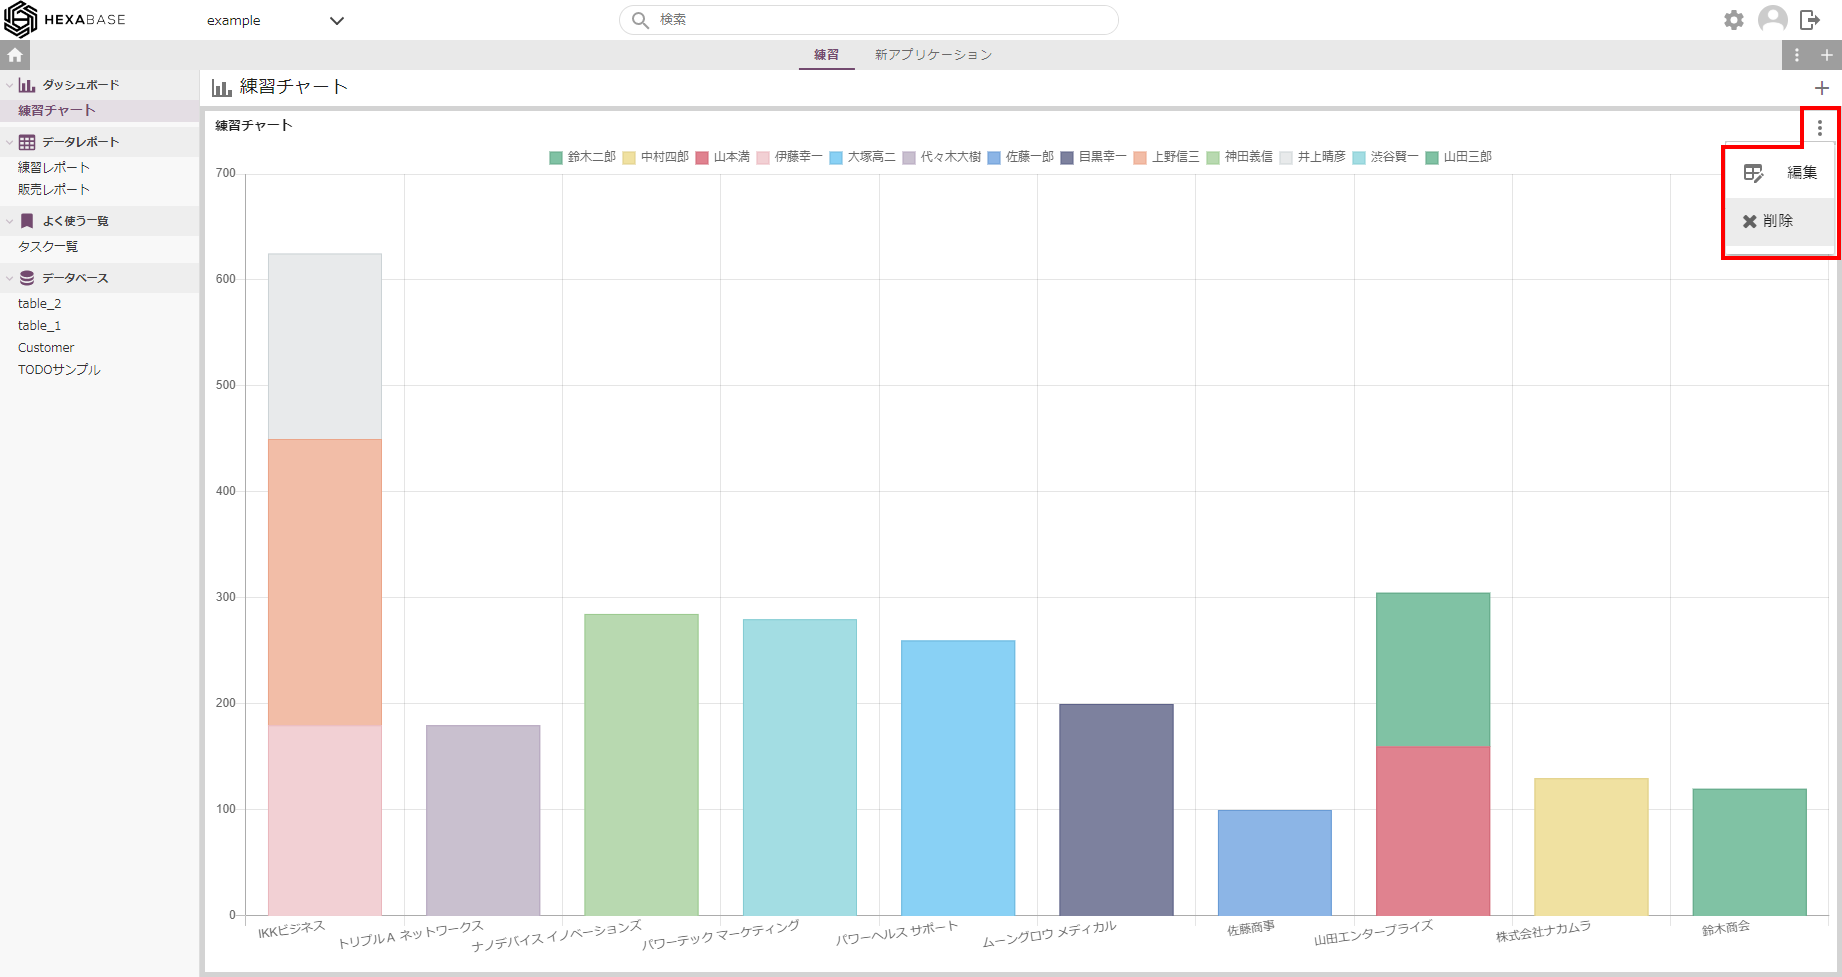
- To change chart settings, click the [ ⁝ ] button on the top right of the chart
- Select "edit" from the menu
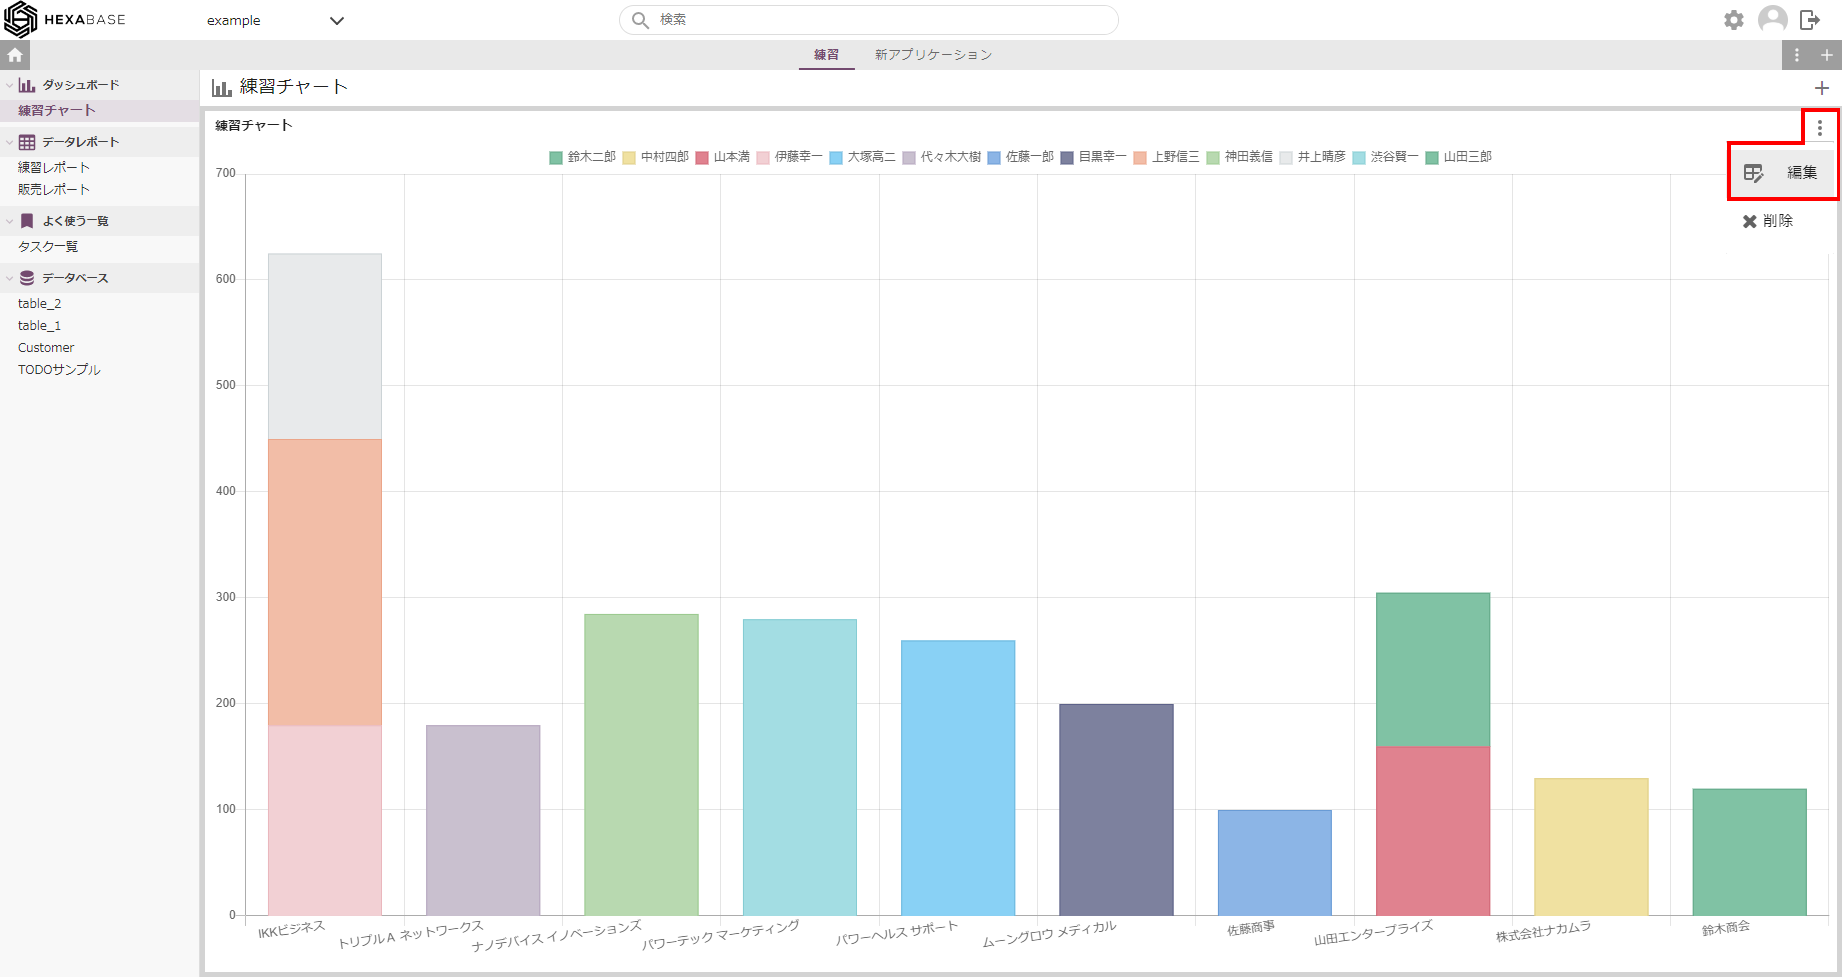
Delete chart
- To change chart settings, click the [ ⁝ ] button on the top right of the chart
- Select "delete" from the menu
Change board layout
If you have multiple charts, you can drag and drop their borders to reposition and resize them.