Data Report
A "Data report" is a feature that allows you to view only specific items or fields in a database or to associate and aggregate items from multiple databases. In Hexabase, you can use "Data Report" to create a table for a (report). Also, the dashboard's graphs (charts) will be created based on the data reports.
Let's create a data report
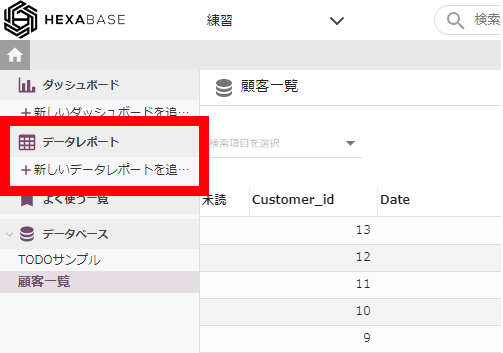
1. Click “+Create new data report”.
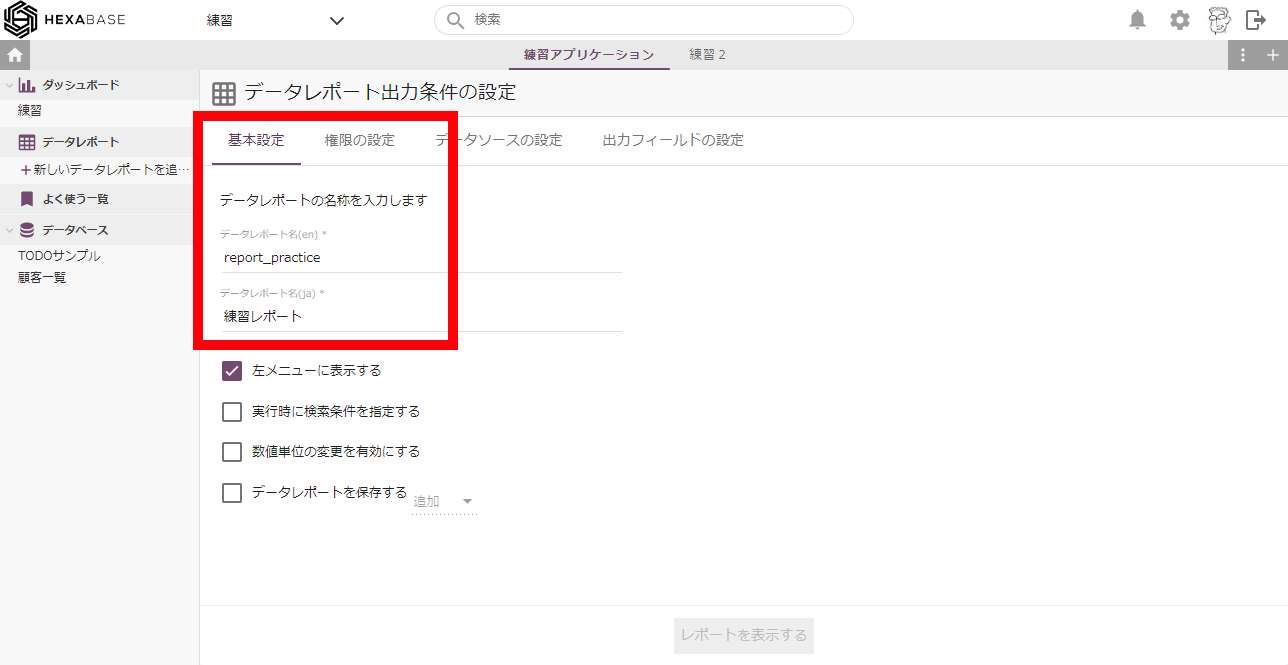
2. When the "Data report condition settings" page is displayed, enter the data report name in "Basic settings".
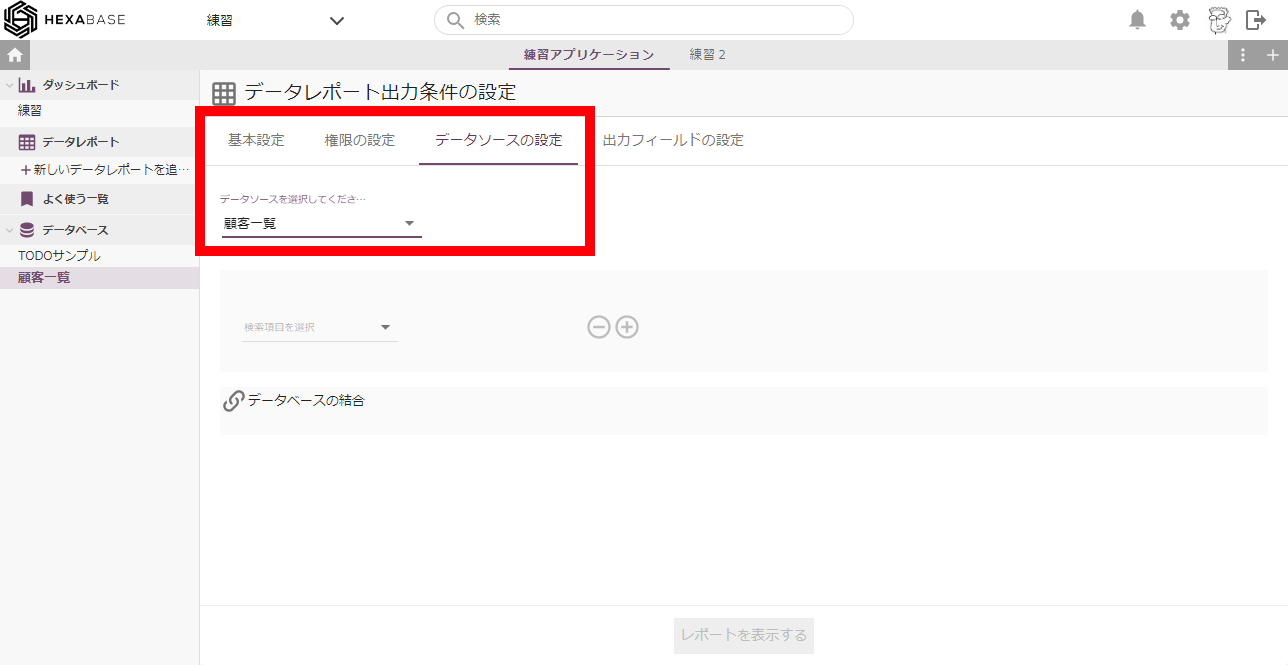
3. Click the "Data Source Settings" tab and select the database you want to use for data reporting. This time, select the database you created earlier.
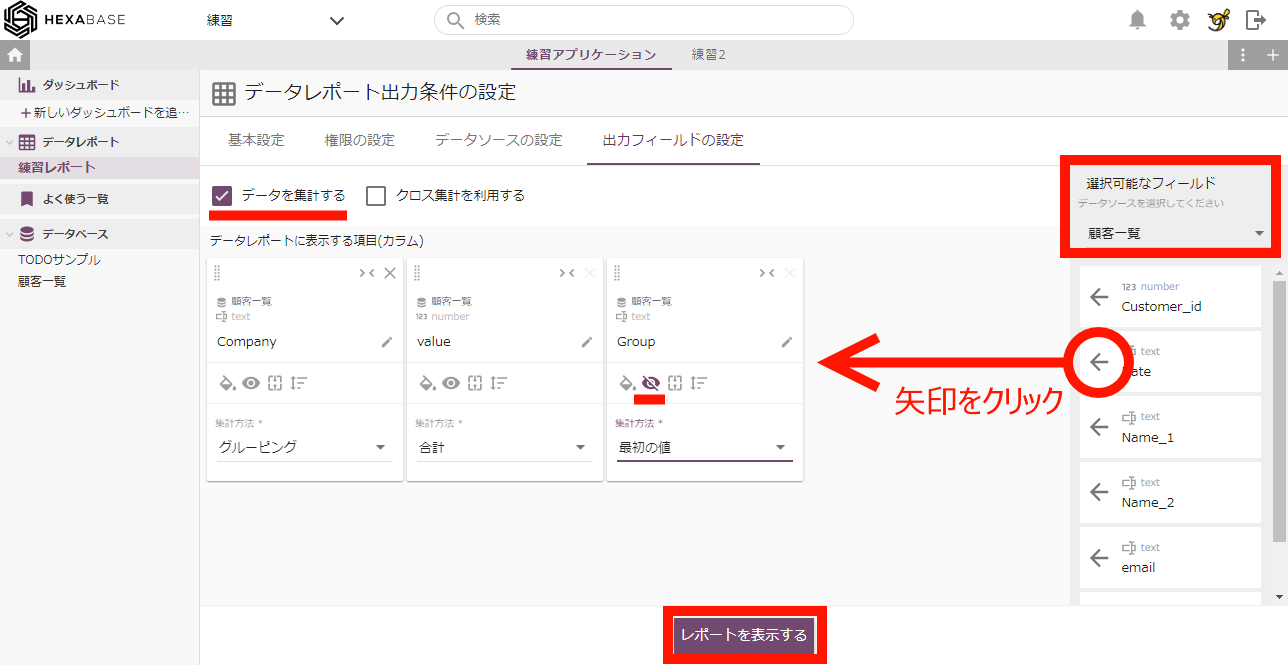
4. After clicking "Output field settings", click the database selected in "Data source settings" in the menu on the right.
5. click on the arrow of the field (field) you want to display in the data report.
e.g.) "Company", "Value", "Group"
6. Keep "Group" hidden
7. Turn on “Aggregate data”.
8. Click the "Show the Data Report" button.
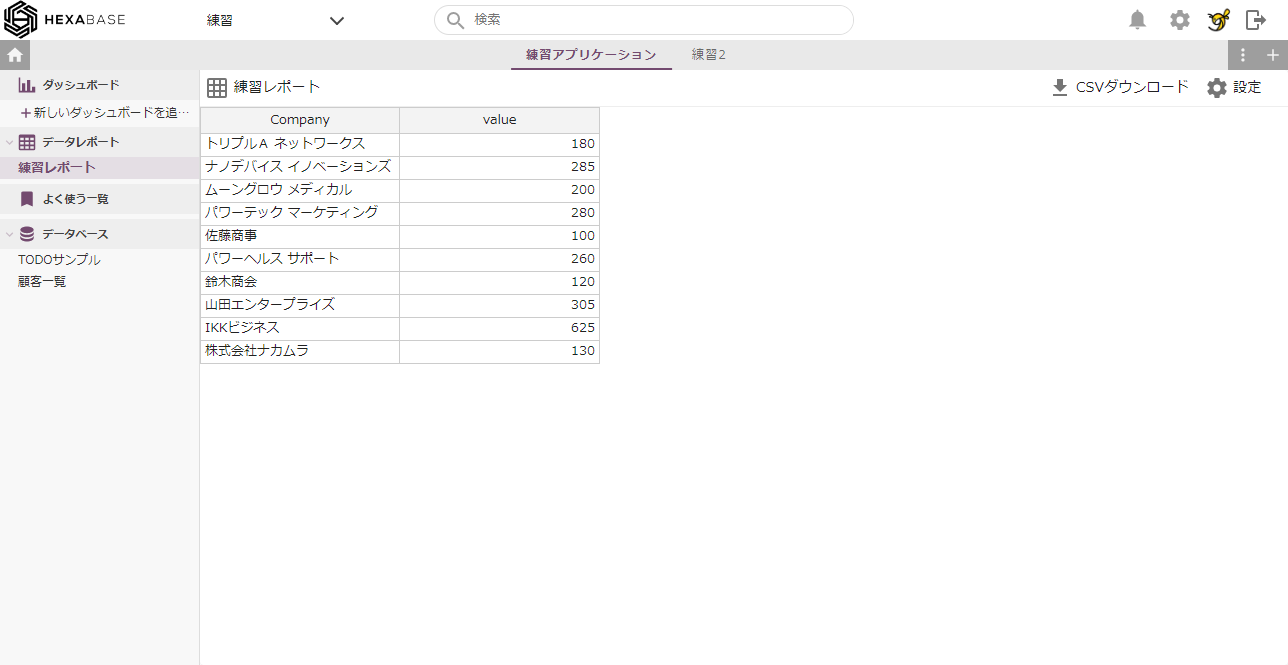
Now we have a data report. I turned on "Aggregate Data" so I grouped by company name and summed the values.
Create second and subsequent data reports
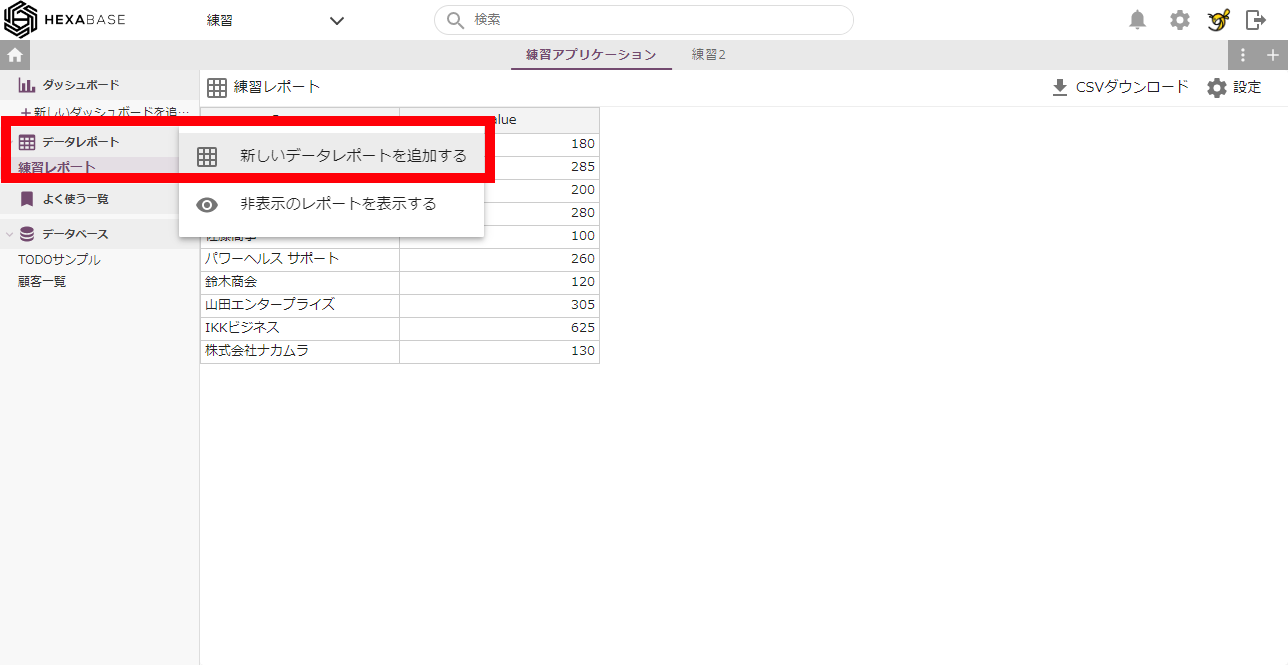
- Hover the mouse over "Data Report" and click the [ ⁝ ] settings button.
- Click "Add new data report" from the menu.
- configure the "Data Report Output Conditions" in the same way as before.
Click the button ... and it's done!
You can even create a chart based on the data report!
※At least 3 fields are required to create a chart.